
Detection and quantitation are different limits
LOD describes a level at which an analyte can be detected. LOQ concerns a level at which it can be measured with suitable accuracy and precision. A detectable signal is not automatically a reliable quantitative result.
ICH Q2(R2) uses the abbreviations DL and QL. Its response-SD and slope approach is one way to estimate these limits; signal-to-noise and other approaches are also described. See ICH Q2(R2), section 3.2.3 (FDA-hosted PDF).
The response-SD and slope calculation
LOD = 3.3 × σ / S
LOQ = 10 × σ / S
Here σ is an estimate of the response standard deviation and S is the calibration slope. The source of σ must be documented and appropriate to the method. ICH Q2(R2), section 3.2.3.3 discusses options including blanks and calibration data.
Watch the units: a response SD in kcps divided by a slope in kcps per µg/L returns a concentration in µg/L. A concentration SD cannot simply be substituted for a response SD in this calculation.
Read the numbers from the LabTools example
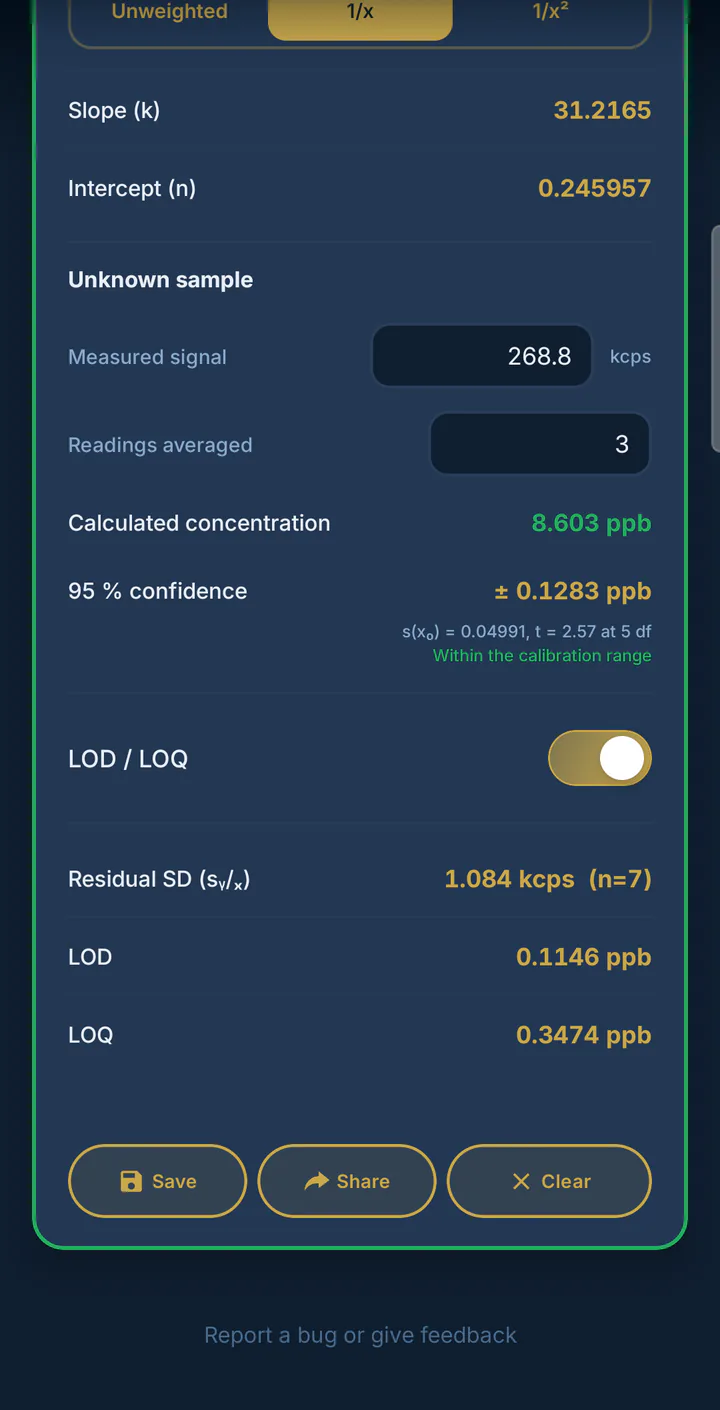
The weighted lead calibration uses seven standards from 0.5 to 50 µg/L. Its slope is 31.2165 kcps per µg/L. The app’s LOD/LOQ panel displays a residual SD of 1.084 kcps, with weighting consistent with the fitted model.
| Quantity | Displayed result |
|---|---|
| LOD | 0.1146 µg/L |
| LOQ | 0.3474 µg/L |
| Lowest standard | 0.5 µg/L |
Using the rounded SD and slope gives approximately 0.115 and 0.347 µg/L. Small differences in the last decimal place reflect the rounded inputs shown on screen. Retain the exported result and its calculation context when documenting the work.
An estimated LOQ is a starting point for confirmation
The calculated LOQ, 0.3474 µg/L, is below the lowest standard in this example. The curve therefore has not demonstrated quantitative performance at that level just by fitting the seven listed standards.
Analyze suitable samples near the estimated LOQ and assess performance against the method’s criteria. ICH Q2(R2), section 3.2.3.5 describes confirmation of estimated limits and cases where justification may apply.
For this drinking-water example, distinguish the curve-based estimate from a limit established through the complete sample preparation and measurement procedure. ICH is pharmaceutical guidance; using its calculation here is not a claim that it replaces the requirements of an environmental method.
Keep the limits with the calibration
In LabTools, LOD and LOQ appear with the calibration results. Method Validation can pull the values into its workflow. Calibration Curve is free; Method Validation and report export are PRO features.
Use the original seven-step walkthrough to inspect the standards, compare fits and see the unknown result before exporting. Open Calibration Curve in the Android app to work with your own measurements.